File:Population and temperature.jpg
From Future Of Mankind
Size of this preview: 800 × 498 pixels. Other resolutions: 320 × 199 pixels | 813 × 506 pixels.
Original file (813 × 506 pixels, file size: 144 KB, MIME type: image/jpeg)
Category:Photos and Images - Other
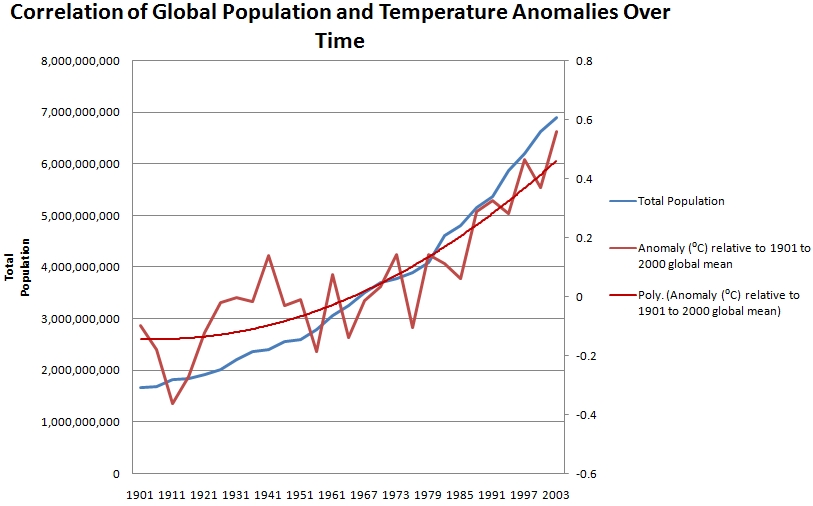
A graph showing the correlation between the rising human population of Earth and the global temperature difference to that of the 1901 to 2000 mean temperature.
Human population data courtesy Ptaah. See Overpopulation_Crusade#Earth_Population_Growth_Chart.
Temperature data courtesy National Climatic Data Center (NCDC), U.S. Dept of Commerce. http://www.ncdc.noaa.gov/oa/climate/research/anomalies/index.php
File history
Click on a date/time to view the file as it appeared at that time.
| Date/Time | Thumbnail | Dimensions | User | Comment | |
|---|---|---|---|---|---|
| current | 14:55, 10 July 2009 | | 813 × 506 (144 KB) | Jamesm (talk | contribs) | A graph showing the correlation between the rising human population of Earth and the global temperature difference to that of the 1901 to 2000 mean temperature. Human population data courtesy Ptaah. See [[Overpopulation_Crusade#Earth_Population_Growt |
You cannot overwrite this file.
File usage
There are no pages that use this file.